To create a map that will show real-time data, we will use this node-red-contrib-web-worldmap pallete.
It is a useful tool for showing real-time data on a map. It allows you to easily display data on a world map in a visual and interactive way. This can be especially useful when working with geolocation data, such as tracking the location of vehicles or monitoring weather patterns.
Another advantage of node-red-contrib-web-worldmap is that it provides a wide range of customization options, such as the ability to display markers, polygons, or heatmaps on the map, change the map's style, and add custom popups.
Read more details in documentation.
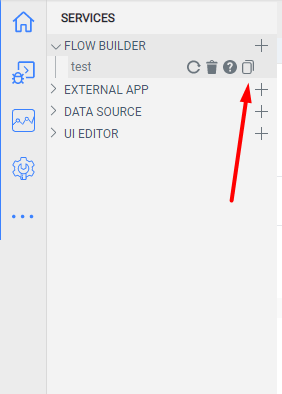
Step 1. Install pallete node-red-contrib-web-worldmap.
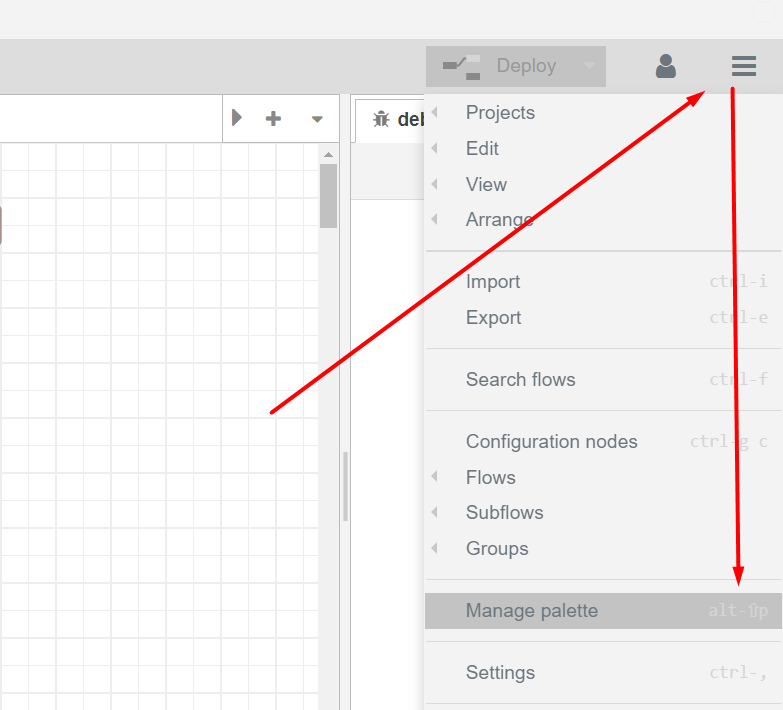
- Navigate to the Manage Palette option in the top right corner.
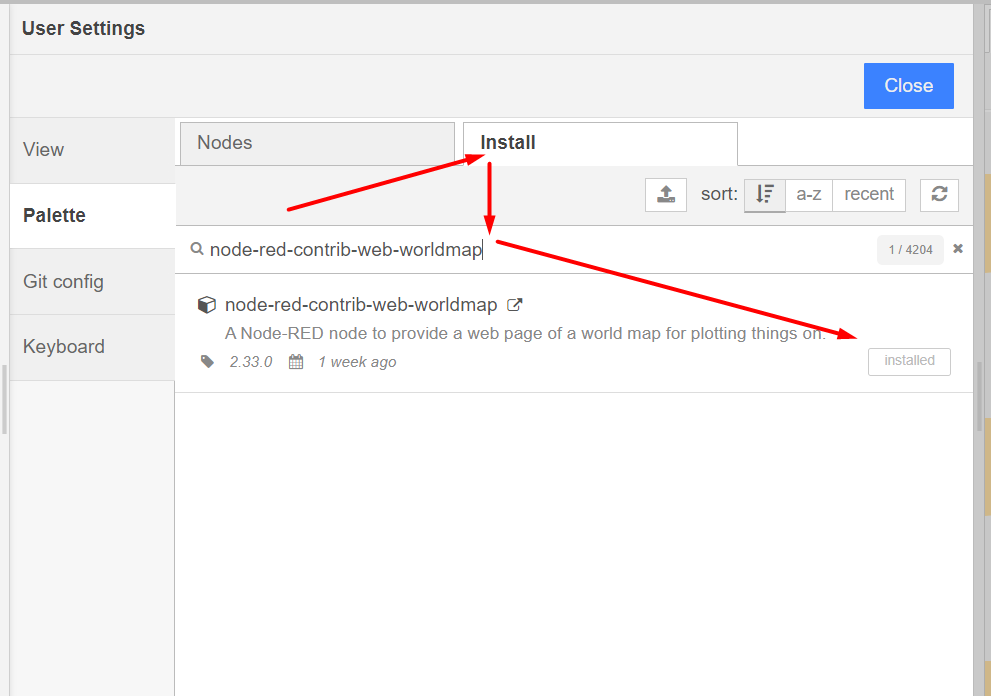
- In the Manage Palette option, select the Install tab and search for "node-red-contrib-web-worldmap" in the search bar. Click on the install button to install the node.
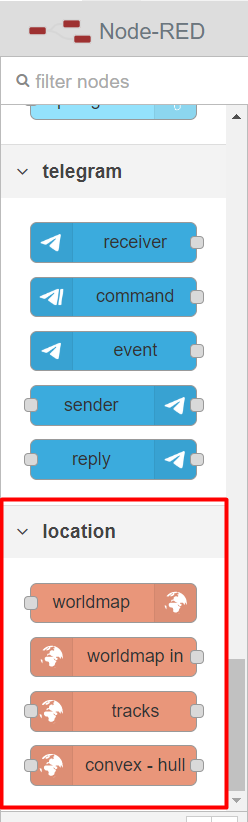
- After the installation is complete, you can now use the node-red-contrib-web-worldmap node in your flows. To do this, drag the node from the palette to the flow and double-click on it to open its configuration options.
Step 2. Create a flow
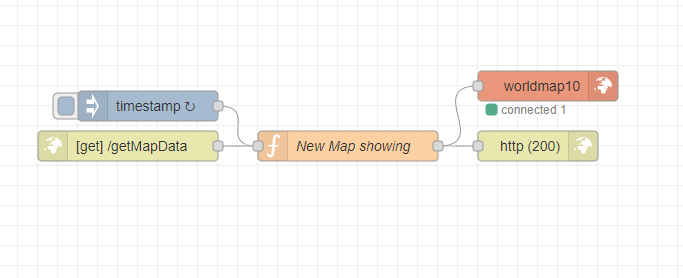
Used nodes:
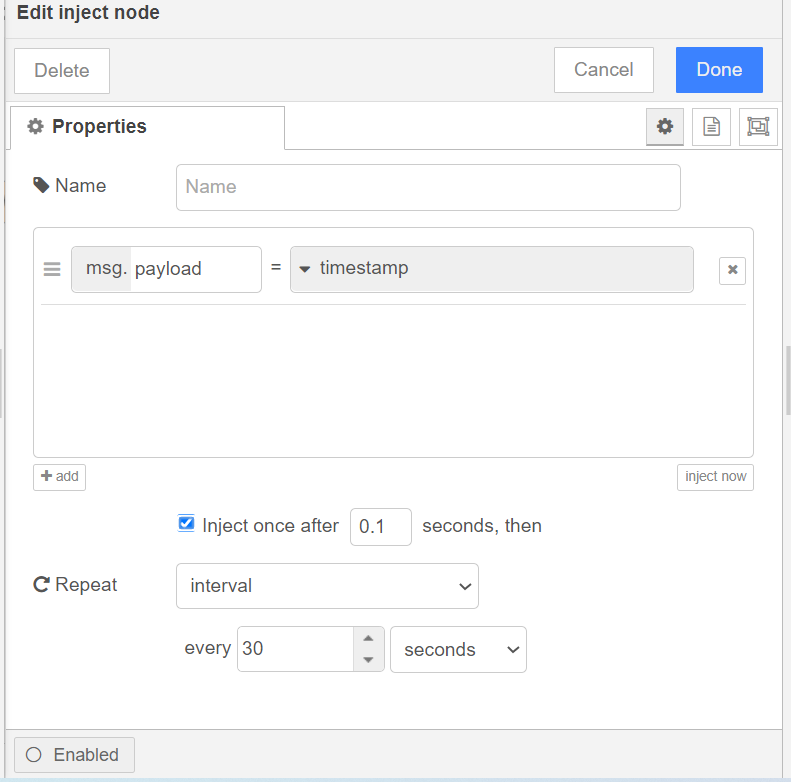
-inject: which allows you to trigger the flow by injecting a payload at regular intervals. In my example, every 30 seconds;
-http in: that listens for a request on the "/getMapData" endpoint;
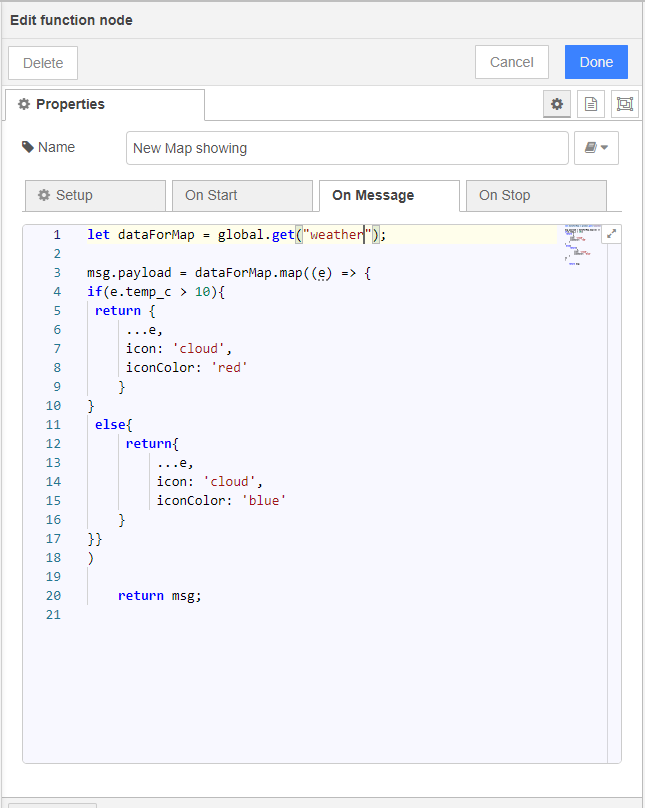
-function: data retrieves a global variable called "weather" and assigns it to a variable called dataForMap. Then, it uses the map method to iterate over the elements in dataForMap. For each element, it checks if the temperature (in Celsius) is greater than 10. If it is, the element is returned with an additional property "icon" set to "cloud", "iconColor" set to "red". If the temperature is less than or equal to 10, the element is returned with an additional property "icon" set to "cloud", "iconColor" set to "blue".
In global variable "weather" I have real-time data that update ever 30 seconds. I have data about weather in London, New York, Canberra, Buenos Aires, Tokyo, Rabat, Kinshasa, and Phnom Penh. And user will see red or blue markers in the map.
My data in global variable "weather".
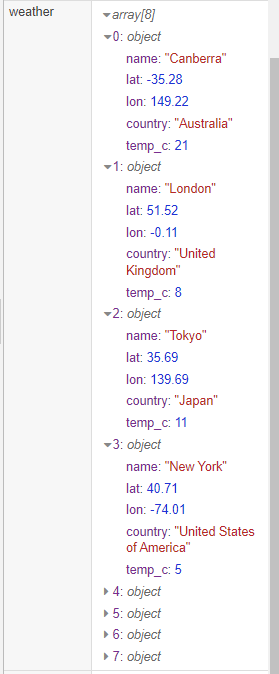
Important: all object's must have lat, lon and unique name properties.
let dataForMap = global.get("weather");

msg.payload = dataForMap.map((e) => {
if(e.temp_c > 10){
 return {
     ...e,
     icon: 'cloud',
     iconColor: 'red'
    }
}
 else{
     return{
         ...e,
         icon: 'cloud',
         iconColor: 'blue'
    }
}}
)

    return msg;
-
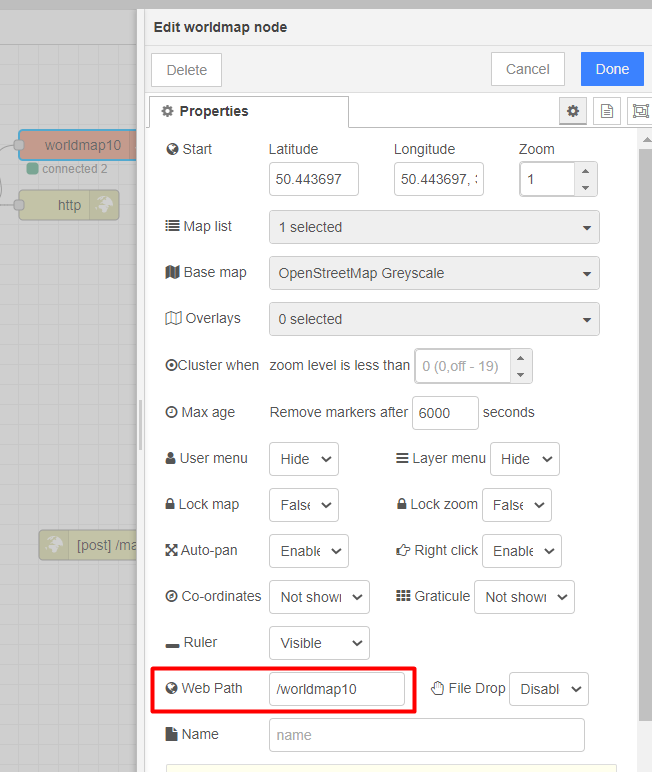
worldmap: the settings for this node include the following:
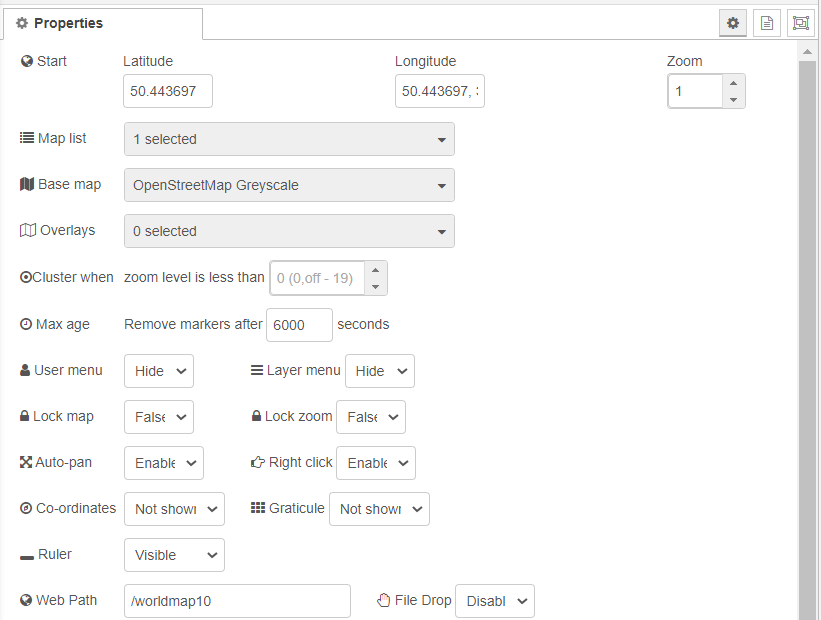
"Lat" and "Lon" are the latitude and longitude coordinates of the center of the map, respectively.
"Zoom" is the zoom level of the map (1 being the lowest level of zoom and 21 being the highest).
"Map list" is set to "OSMG" which means the only available map is OSM standard map.
"Overlays" is empty, so no overlay layers are specified.
"Max age" is set to "6000" which means the data displayed on the map will not be older than 6000ms.
"User menu" and "Layers menu" are both set to "hide" which means that the user menu and layers menu will not be displayed on the map.
"Zoom lock" and "Lock map" are both set to "false" which means the user can pan and zoom the map.
"Right click" is set to "false" which means the right-click context menu will be displayed on the map.
"Co-ordinates" is set to "none" which means that the coordinates will not be displayed on the map.
"File Drop" is set to "false" which means the user will not be able to drop file on the map.
"Web Path" is set to "/worldmap10" which is the URL path of the map.
You can choose the other setting you need.
Step 3. Show in UI
To show this map in UI use widget "iframe".
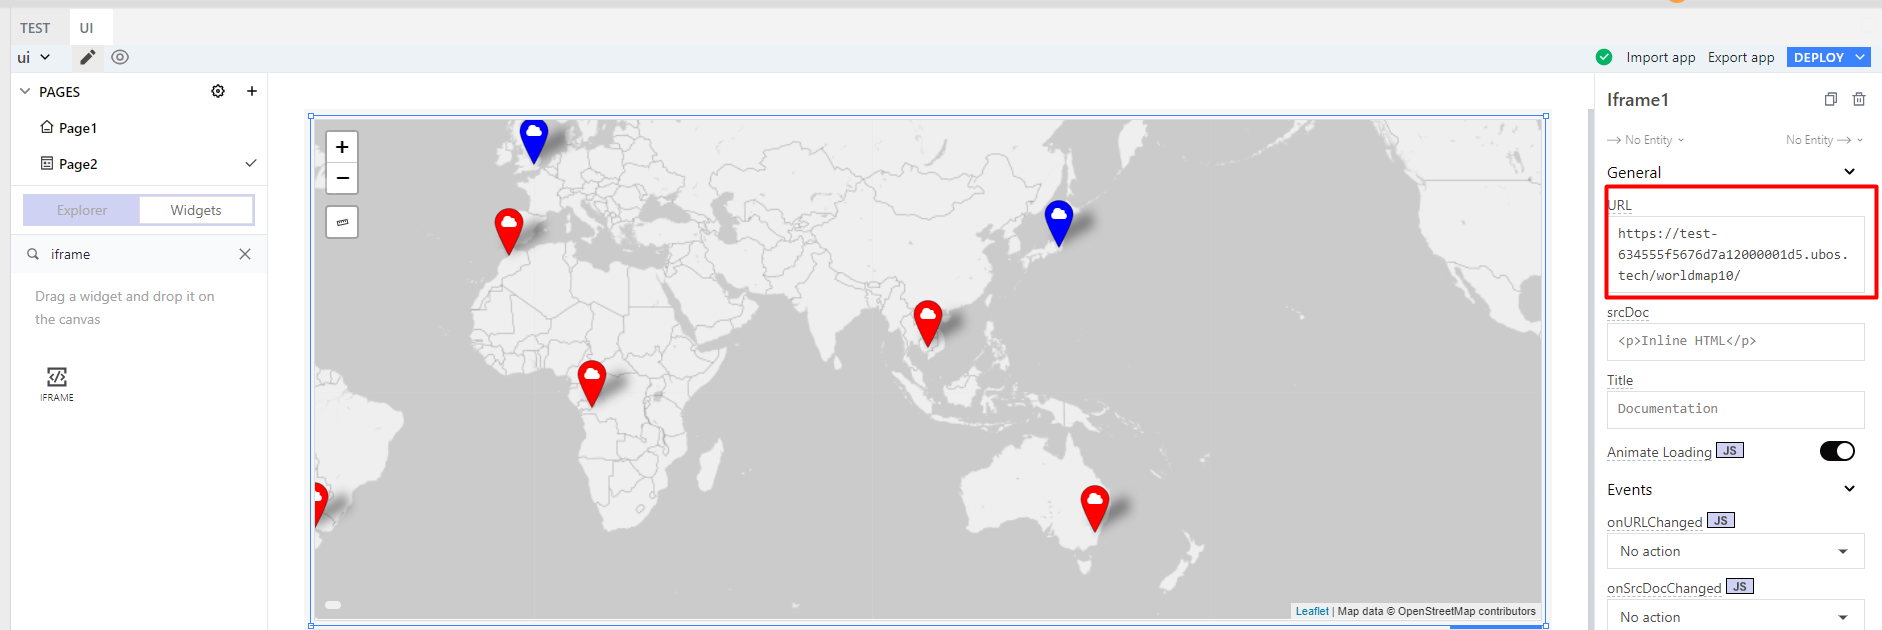
In URL write the path to your map in Node-Red that contain:
-
URL to your Node-Red
-
your map URL path
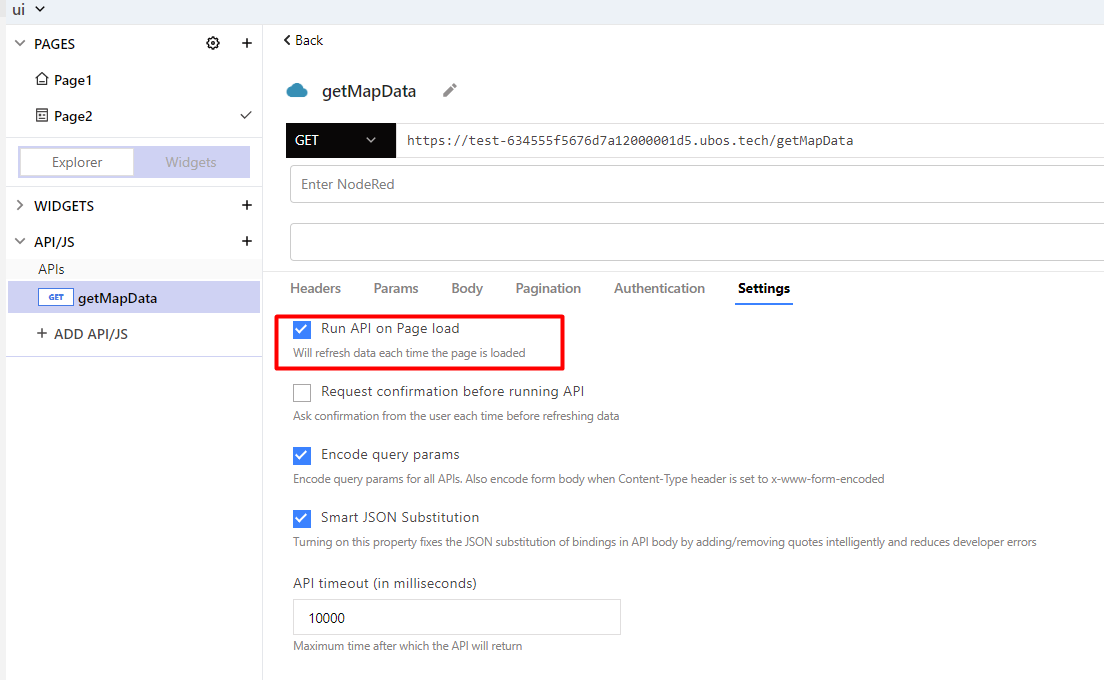
Also create a API that will run on page load to triger a flow with map and get data after first load.
Summary:
Creating a real-time map using Node-Red and UBOS, a low-code platform, is a simple and straightforward process. By utilizing the power of Node-Red for server-side scripting and UBOS for easy deployment and management, developers can quickly and easily create dynamic, real-time maps with minimal effort. The use of a low-code platform UBOS also allows for a more user-friendly experience for those without extensive development experience. Overall, creating a real-time map using Node-Red and UBOS is a great option for those looking to add dynamic mapping functionality to their projects.


Top comments (1)
Will this allow for drawing azimuths across the world like the google draw and line tools and how accurate? After MetaReps, this is another project I am interested in as a research project. It would be great to do it off of the google maps platform completely if possible? I will look up the Node Red app for maps and do some research. Thanks!