The node-red-contrib-web-worldmap library offers several benefits to users who want to display track information. Firstly, it eliminates the need for complex coding and programming knowledge. All that is required is a basic understanding of how to create flows within Node-RED and how to format the data that will be displayed on the map.
Another advantage of using this library is that it offers a user-friendly interface that makes it easy to customize the display of track information. This includes the ability to change the icon and color used to represent the track on the map, as well as the ability to label the track with custom information.
Finally, the node-red-contrib-web-worldmap library provides a highly responsive and dynamic display of real-time track data. The library updates the information displayed on the map in real-time, making it an excellent solution for tracking the movement of vehicles, people, or assets.
In conclusion, the node-red-contrib-web-worldmap library is a simple and effective solution for users looking to display real-time track data. Its integration with Node-RED, user-friendly interface, and responsive display make it a better choice compared to other options available on the market.
Step 1. Install pallete node-red-contrib-web-worldmap.
How to install pallete read in previous part.
Step 2. Create a flow
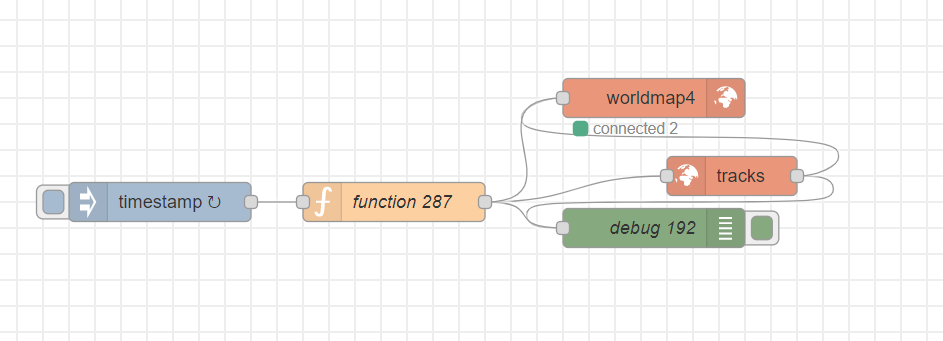
Used nodes:
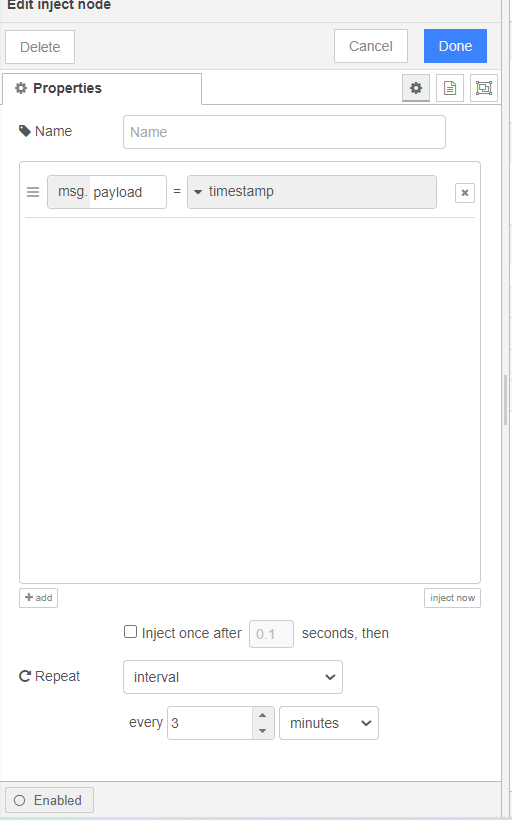
-inject: which allows you to trigger the flow by injecting a payload at regular intervals. In my example, every 3 minutes;
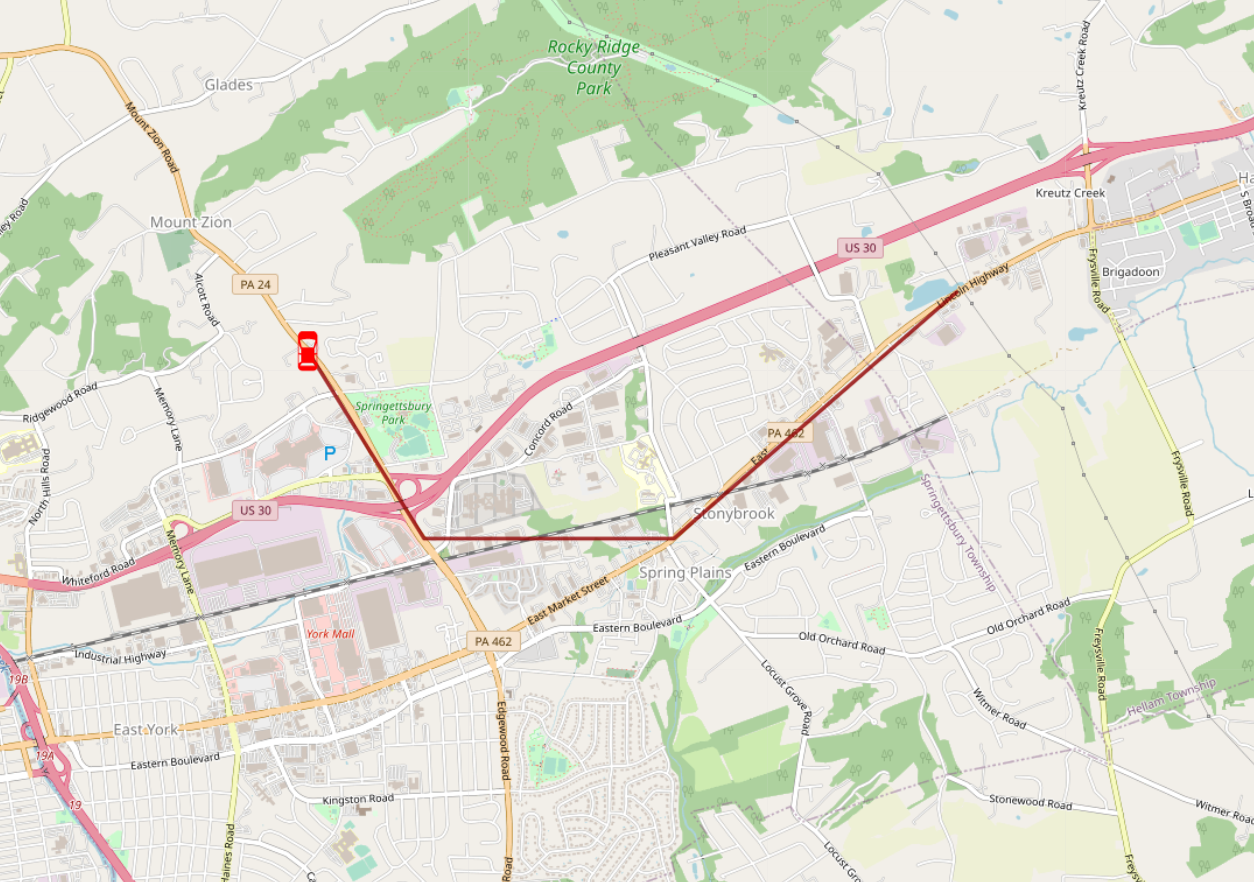
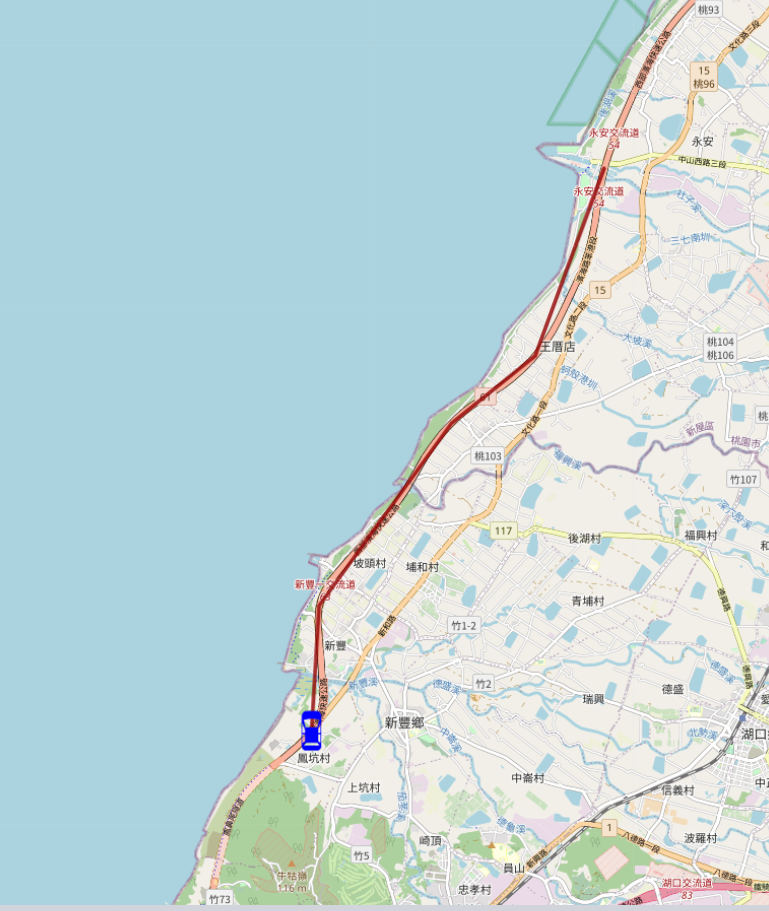
-function: this function creates an array of objects that represent two cars (one blue and one red) with their respective latitude, longitude, layer, name, and icon. The layer name "Car" is used to display the vehicles on the map, while the name and icon properties describe the appearance of each vehicle. The blue vehicle is represented by a blue car icon, while the red vehicle is represented by a red car icon.Property name must be unique!
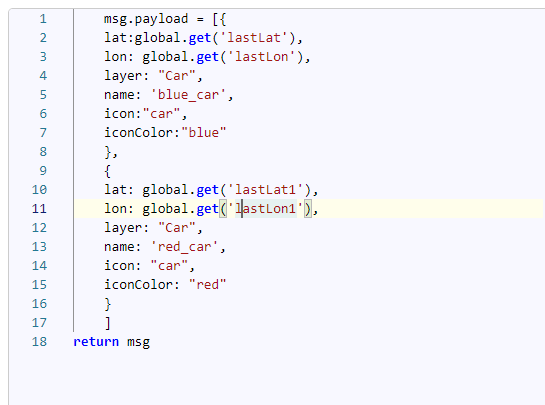
    msg.payload = [{
    lat:global.get('lastLat'),
    lon: global.get('lastLon'),
    layer: "Car",
    name: 'blue_car',
    icon:"car",
    iconColor:"blue"
    },
    {
    lat: global.get('lastLat1'),
    lon: global.get('lastLon1'),
    layer: "Car",
    name: 'red_car',
    icon: "car",
    iconColor: "red"
    }
    ]
return msg
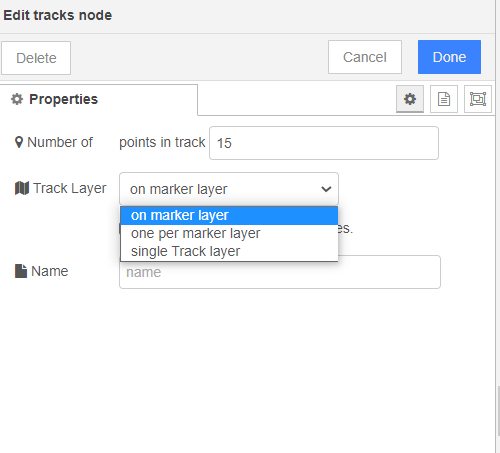
-tracks:
Marker Layer: It allows to display multiple markers on the same layer.Single Ad Layer: It is a separate layer for each marker.One Per Marker Layer: In this option, you can create a separate layer for each marker.
You can choose the layer option that suits your requirement, depending on how you want to display markers on the map.
Also you can choose points of track that mean how many points will shown on map.
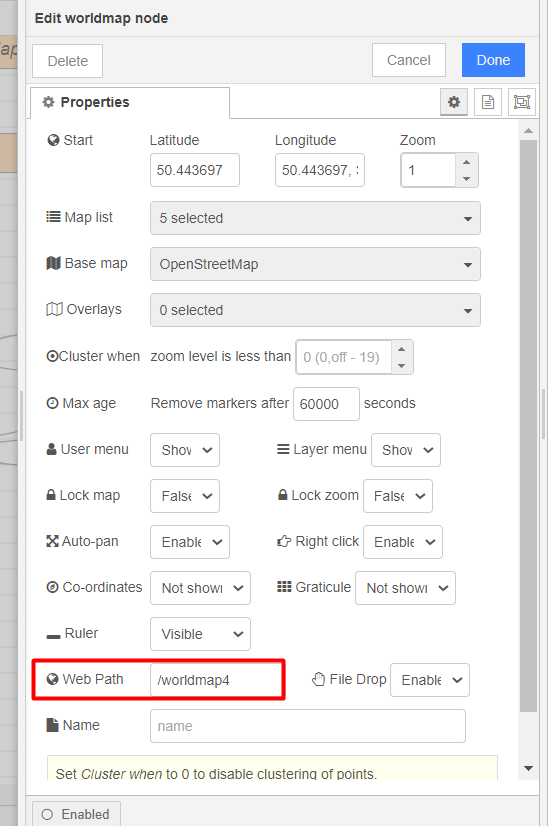
-worldmap: about settings read here
Step 3. UI Editor
To show this map in UI use widget "iframe".
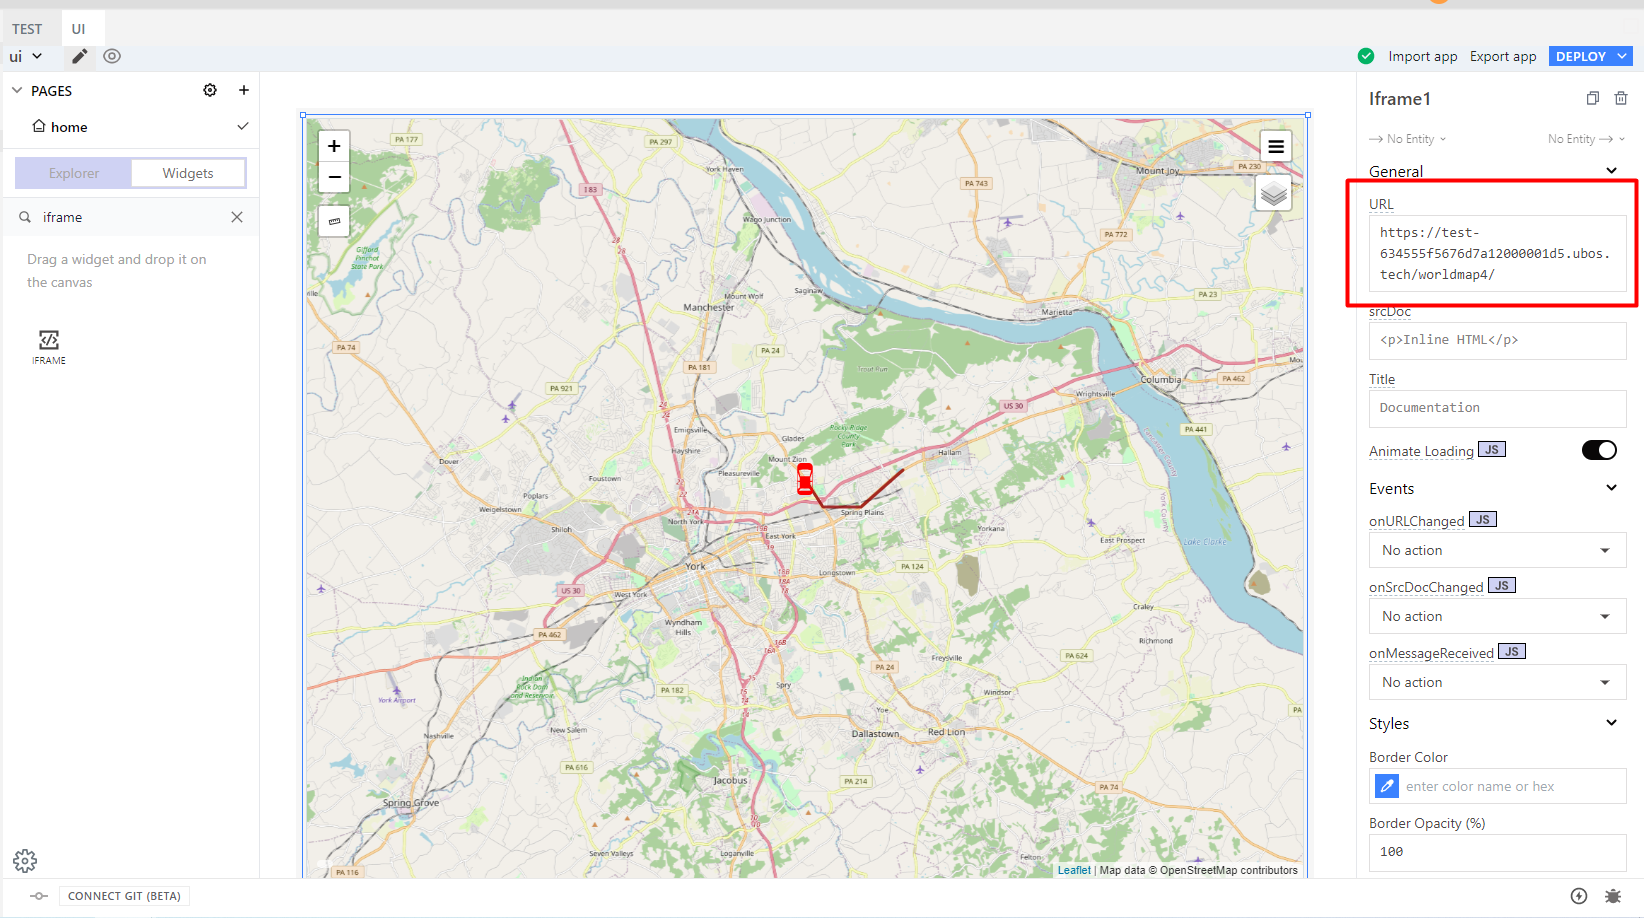
In URL write the path to your map in Node-Red that contain:
-URL to your Node-Red
-your map URL path
Summary:

Using Node-RED and UBOS is a better option to show real-time track data due to its user-friendly, drag and drop interface and pre-built libraries, such as node-red-contrib-web-worldmap, which makes it easier for users without development experience to visualize and manipulate the data. These tools allow for quick and efficient development without the need for extensive coding knowledge, saving time and resources. Additionally, Node-RED provides a platform for integrating various data sources and UBOS offers a secure and efficient infrastructure for deploying Node-RED applications, making it a reliable solution for real-time track data visualization.

Top comments (0)